
ImageSeedream 4.5
Electric vs. Gasoline Cars Comparison
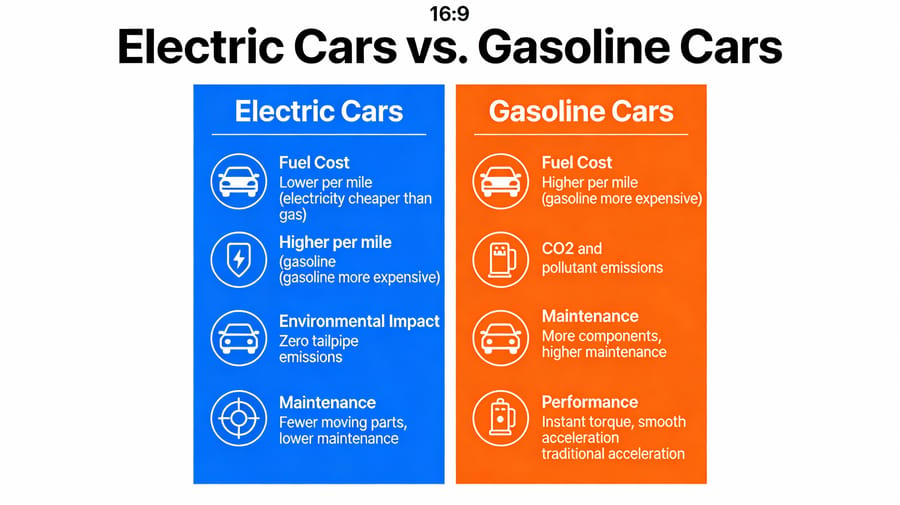
This prompt creates a visual comparison chart comparing electric cars and gasoline cars. It uses a clean, modern design with icons and brief text to organize and present comparative data clearly and concisely.
Prompt
A visual comparison chart (a “vs.” infographic) comparing electric cars and gasoline cars. The chart should have two columns, with icons and brief text comparing them on factors like Fuel Cost, Environmental Impact, Maintenance, and Performance. The design should be clean, modern, and easy to understand at a glance, demonstrating the ability to visually organize and present comparative data. –ar 16:9
How to use this prompt
- 1Copy the prompt exactly, then paste it into your preferred model or Ideart project.
- 2Replace product, subject, audience, and style details with your own context.
- 3Generate one baseline result first, then remix the strongest direction into a campaign, image set, or video concept.
Explore nearby prompt paths
Model
Build from this prompt
Turn a image prompt into a finished creative project.
Save the prompt, add reference images or notes, and let Ideart shape the next production step from the same creative thread.